Fantastic GIF Visualization Shows How Hot the World Has Gotten Since 1850
| Arthur Dominic Villasanta | | May 11, 2016 12:49 AM EDT |

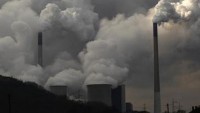
(Photo : Ed Hawkins) Global temperature spiral illustration.
Over 97 percent of climate scientists agree the Earth is warming and that human activity is the main cause of global warming.
A new and stunning GIF visualization of this fact placed online on Twitter has become so popular it's overtaxing the servers that house it. And rebuts the illogical claim of climate change deniers this warming is part of the natural scheme of things.
Like Us on Facebook
Small wonder the servers are overextended. That's because the spiral global temperature animation created by climate scientist Ed Hawkins of the National Centre for Atmospheric Science at the University of Reading is an excellent illustration of how hot the Earth has gotten from 1850 until 2016.
You can play the animation here at Hawkins' Twitter account.
What you're seeing is a circular graph that unwinds to show the temperature change every month since 1850. That's a record of 166 years compressed into one easy-to-grasp graphic. As the months and years pass, the planet warms and the circles expand outward to the hottest point in those 166 years, which is this year, 2016.
The animation is based on global temperature data from the Hadley Centre of the United Kingdom's Met Office.
"The animated spiral presents global temperature change in a visually appealing and straightforward way," said Hawkins. "The pace of change is immediately obvious, especially over the past few decades."
"I think there is lots to see -- variations from month to month and decade to decade," said Hawkins. "I wanted to try and visualize the changes we have seen in different ways to learn about how we might improve our communication.
"The spiral appeared to present the information in an appealing and straightforward way. The pace of change is immediately obvious, especially over the past few decades. The relationship between current global temperatures and the internationally discussed target limits are also clear without much complex interpretation needed."
Tagsglobal warming, Ed Hawkins, Hadley Centre of the United Kingdom's Met Office, Climate Change
©2015 Chinatopix All rights reserved. Do not reproduce without permission


EDITOR'S PICKS
-

Did the Trump administration just announce plans for a trade war with ‘hostile’ China and Russia?
-

US Senate passes Taiwan travel bill slammed by China
-

As Yan Sihong’s family grieves, here are other Chinese students who went missing abroad. Some have never been found
-

Beijing blasts Western critics who ‘smear China’ with the term sharp power
-

China Envoy Seeks to Defuse Tensions With U.S. as a Trade War Brews
-

Singapore's Deputy PM Provides Bitcoin Vote of Confidence Amid China's Blanket Bans
-

China warns investors over risks in overseas virtual currency trading
-

Chinese government most trustworthy: survey
-

Kashima Antlers On Course For Back-To-Back Titles
MOST POPULAR
LATEST NEWS
Zhou Yongkang: China's Former Security Chief Sentenced to Life in Prison

China's former Chief of the Ministry of Public Security, Zhou Yongkang, has been given a life sentence after he was found guilty of abusing his office, bribery and deliberately ... Full Article


TRENDING STORY

China Pork Prices Expected to Stabilize As The Supplies Recover
-
Elephone P9000 Smartphone is now on Sale on Amazon India
-
There's a Big Chance Cliffhangers Won't Still Be Resolved When Grey's Anatomy Season 13 Returns
-
Supreme Court Ruled on Samsung vs Apple Dispute for Patent Infringement
-
Microsoft Surface Pro 5 Rumors and Release Date: What is the Latest?